Fototapety

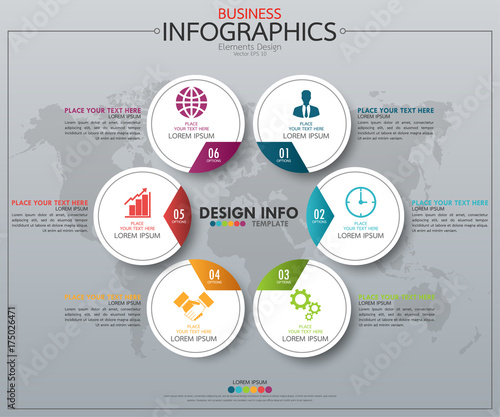
  • Visual data presentation. Cycle diagram with 6 options. Pie Chart Circle infographic template with 6 steps, options, parts, segments. Business concept. Marketing infographic vector illustration.
    Dodaj do ulubionych
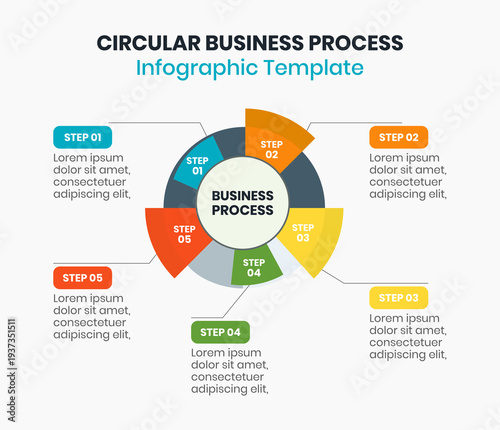
  • Circular Business Process Infographic Template, 5 Step Workflow Cycle Diagram, Corporate Strategy Timeline Infographics
    Dodaj do ulubionych
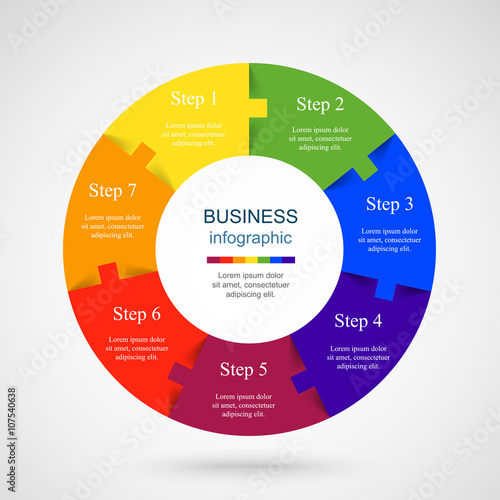
  • Vector infographic template
    Dodaj do ulubionych
  • Vector infographic template
    Dodaj do ulubionych
  • Infographic design template with place for your data. Vector illustration.
    Dodaj do ulubionych
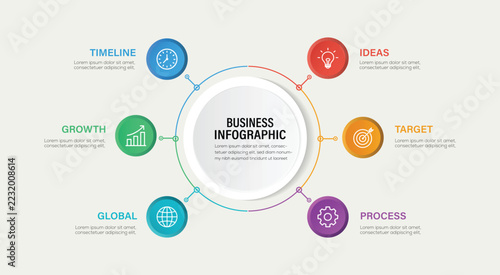
  • Business Infographic with Ideas Target Process Growth Global Timeline on Circular Diagram. Vector illustration
    Dodaj do ulubionych
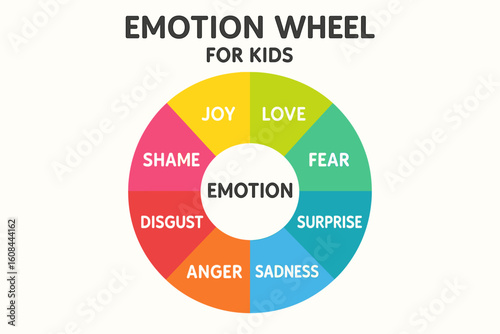
  • Colorful Emotion Wheel for Kids – SEL Learning Tool
    Dodaj do ulubionych
  • Diagram concept with Web Application text and keywords. EPS 10 isolated on white background
    Dodaj do ulubionych
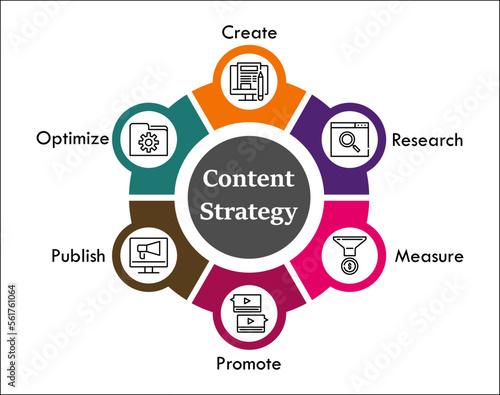
  • Content Strategy with icons in an infographic template
    Dodaj do ulubionych
  • Business data visualization.Steps Process chart. Abstract elements of graph, diagram with steps, options, parts or processes. Vector business template for presentation Vector Design
    Dodaj do ulubionych
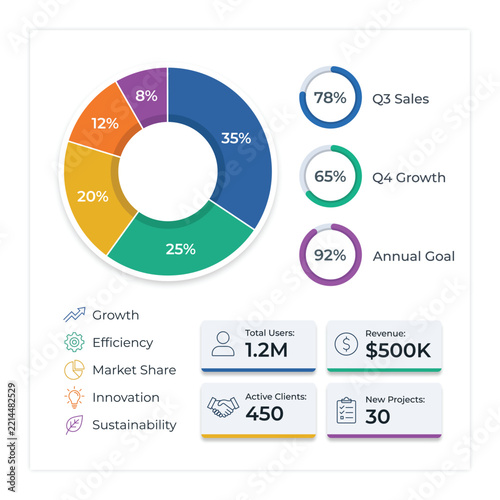
  • Professional Business Infographic Template with Donut Charts, Data Visualization and Corporate Icons
    Dodaj do ulubionych
  • 6 Circle infographic
    Dodaj do ulubionych
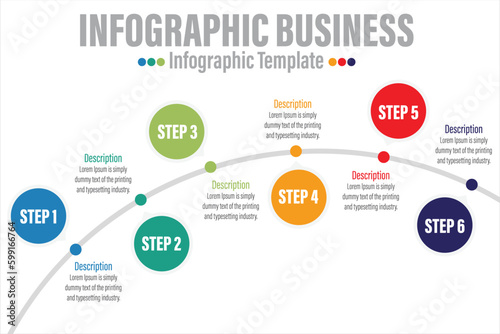
  • 6 Steps modern Timeline diagram calendar with Yearly and pip , presentation vector infographic. Infographic template for business.
    Dodaj do ulubionych
  • This modern infographic illustrates key digital marketing insights and methods, covering social media, organic search, email campaigns, content, and paid advertising for business growth.
    Dodaj do ulubionych
  • Abstract diagram with 6 steps, options, parts or processes. Vector business template for presentation
    Dodaj do ulubionych
  • Modern Design Minimal infographic template
    Dodaj do ulubionych
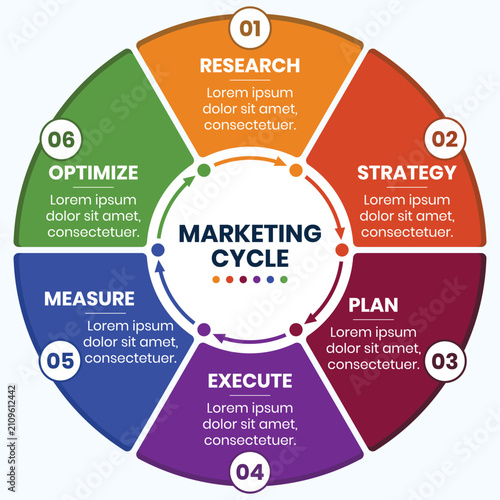
  • 6 Step Marketing Cycle Infographic Template for Campaign Planning, Customer Engagement and Performance Optimization
    Dodaj do ulubionych
  • Modern Infographic Template
    Dodaj do ulubionych
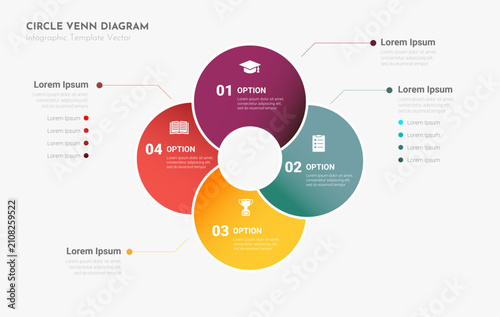
  • Circle Venn Diagram Infographic Template - Four Part Circular Venn Diagram Illustrating Business Options Educational Pathways and Project Management Strategies for Data Visualization
    Dodaj do ulubionych
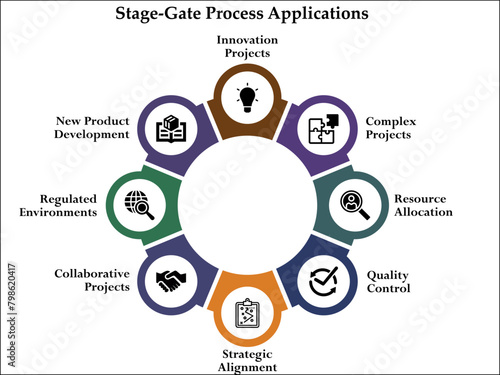
  • Eight Stage-Gate process application. Infographic template with icons and description placeholder
    Dodaj do ulubionych
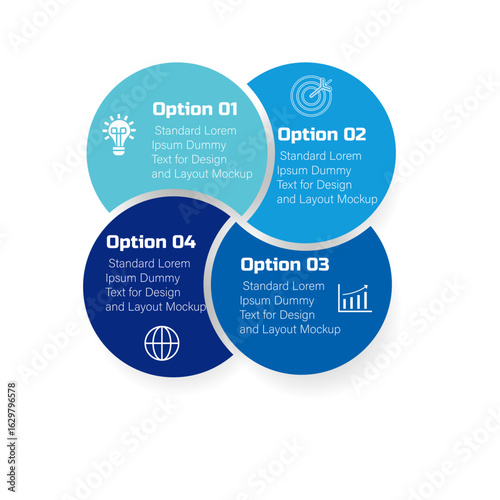
  • Business data visualization-Timeline infographic design with 4 steps blue circle vector element for business template, modern diagram, process, technology, digital marketing, data presentation
    Dodaj do ulubionych
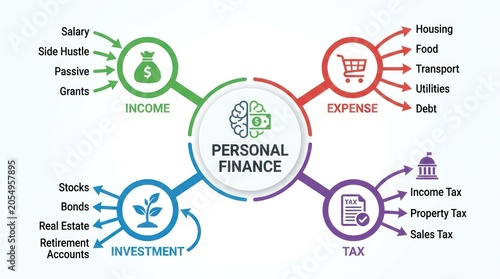
  • Personal Finance Management Infographic
    Dodaj do ulubionych
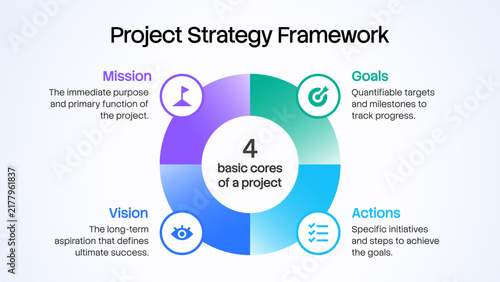
  • 4 Quadrant Circular Infographic Vector Template Featuring Core Pie Chart Diagram in Clean Light Theme and Horizontal Layout for Project Strategy Framework Presentation
    Dodaj do ulubionych
  • Vector circle arrows for infographic, diagram. 7 steps, options.
    Dodaj do ulubionych
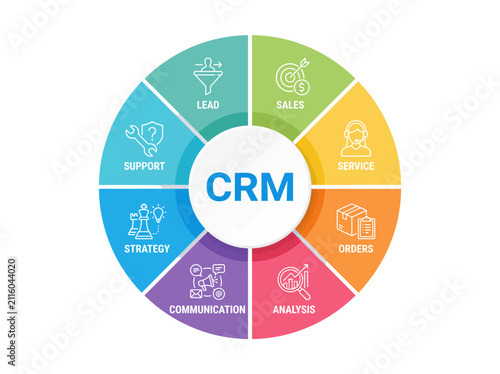
  • CRM cycle diagram with business icons. Customer relationship management process infographic.
    Dodaj do ulubionych
  • Presentation vector business infographic template with 6 steps stock illustration infographic list circle
    Dodaj do ulubionych
  • Modern business circle infographic chart template for presentation with icons and 5 options or steps.
    Dodaj do ulubionych
  • Vector infographic template for diagram, graph, presentation, chart, business concept with 8 options.
    Dodaj do ulubionych
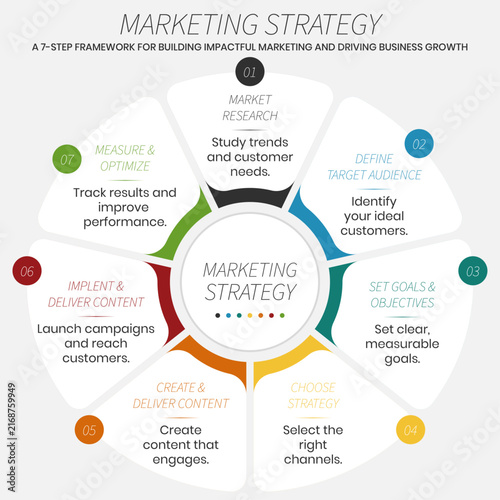
  • 7 Steps Marketing Strategy Infographic Template for Business Growth and Digital Promotion, branding, goals
    Dodaj do ulubionych
  • Infographic business timeline process chart template. Vector modern banner used for presentation and workflow layout diagram, web design. Abstract elements of graph options.
    Dodaj do ulubionych
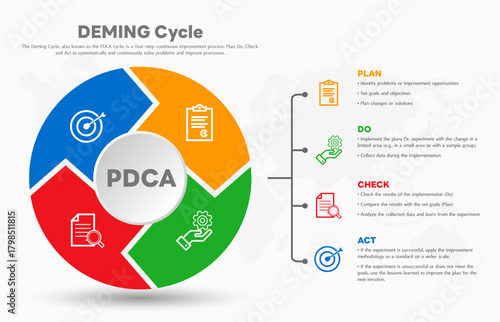
  • The Deming Cycle or the PDCA cycle is a method for continuous improvement in organizations. Plan Do Check Act Vector Illustration. Business concept. Marketing infographic. All in a single layer.
    Dodaj do ulubionych
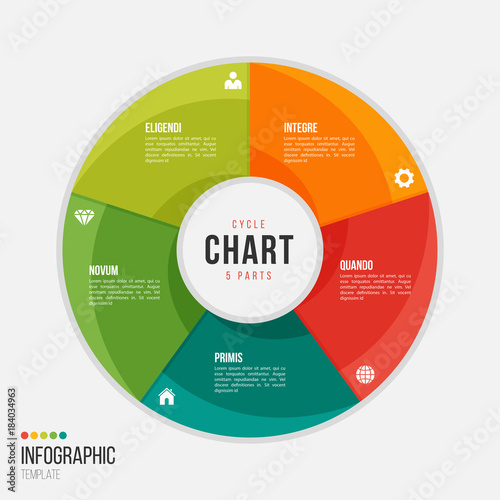
  • Cycle chart infographic template with 5 parts, options, steps
    Dodaj do ulubionych
  • Circle infographic template. Outline Diagram with 5 elements or steps. Workflow, layout template. Business process and presentation concept. Organization chart. Vector illustration.
    Dodaj do ulubionych
  • Six steps of Green Human resource Management with icons in an infographic template
    Dodaj do ulubionych
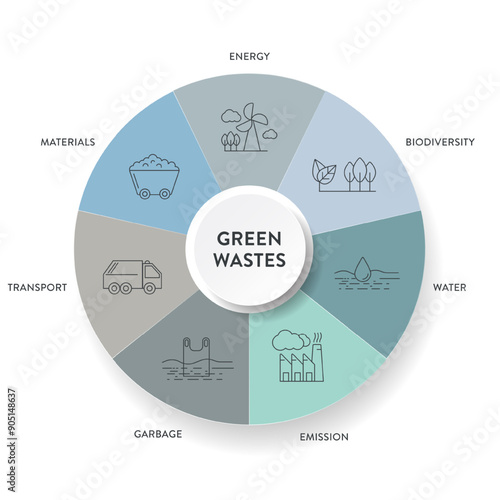
  • 7 green waste reduction strategy infographic diagram chart banner template with icon for presentation has transportation, garbage, material, water, biodiversity, energy and emission. Carbon footprint.
    Dodaj do ulubionych
  • Business Infographic Design with Multiple Business Elements
    Dodaj do ulubionych
  • Business infographic. Organization chart with 4 options. Vector template.
    Dodaj do ulubionych
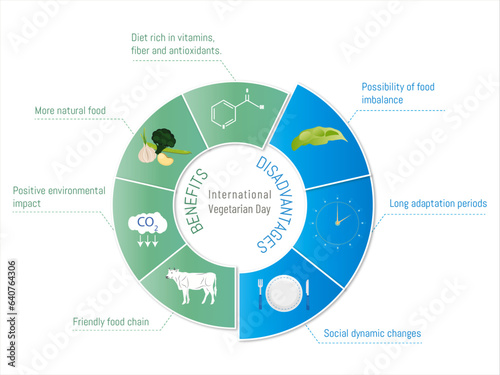
  • Circular diagram of benefits and disadvantages of vegetarianism in shades of green and blue on a white background.
    Dodaj do ulubionych
  • Infographic template for business 8 Steps processes modern Timeline chart
    Dodaj do ulubionych
  • Marketing Flywheel model infographic presentation vector. Marketing Flywheel focuses on marketing and sales efforts for customer such as strangers, prospects, promoters. Traditional marketing concept.
    Dodaj do ulubionych

Ta strona używa ciasteczek do przechowywania informacji na Twoim komputerze. więcej >> ×