Fototapety

  • Components of Cycle of Anxiety
    Dodaj do ulubionych
  • Four section presentation layout with text areas and image placeholders
    Dodaj do ulubionych
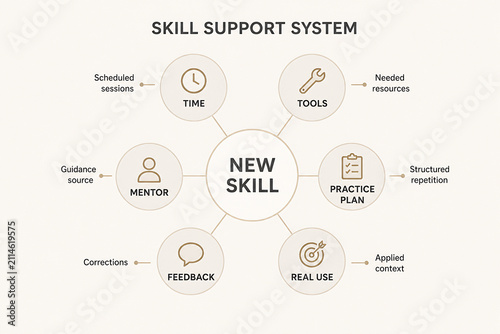
  • A diagram illustrating the components of a Skill Support System, including Time, Tools, Mentor, Feedback, Practice Plan, Real Use, and Needed Resources.
    Dodaj do ulubionych
  • circle timeline step for pregnant or pregnancy infographic concept for slide presentation with 6 Steps, Six 6 option and 6 point list
    Dodaj do ulubionych
  • Components of Inventory Management Process
    Dodaj do ulubionych
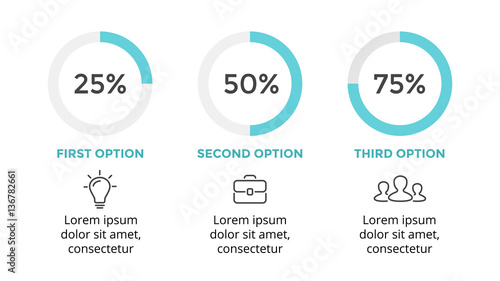
  • Vector circle infographic, cycle diagram, graph, presentation pie chart. Business concept with 3 options, parts, steps, processes. 16x9 minimal slide. Percents status.
    Dodaj do ulubionych
  • Adobe Illustrator Artwork
    Dodaj do ulubionych
  • The Change Kaleidoscope Model with Icons and description placeholder in an Infographic template
    Dodaj do ulubionych
  • Infographic layout with three image placeholders and numbered steps for presentation
    Dodaj do ulubionych
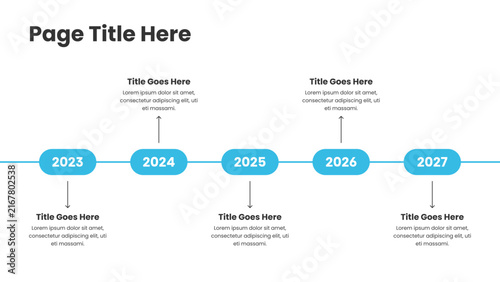
  • presentation infographic page. landscape slide on white background. yearly roadmap plan.
    Dodaj do ulubionych
  • Adobe Illustrator Artwork
    Dodaj do ulubionych
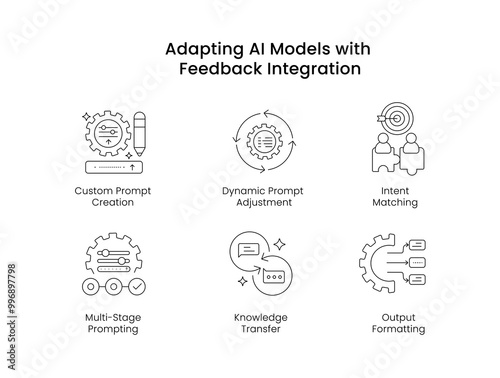
  • Adapting AI Models with Feedback Integration. Icons included: Knowledge Transfer, Dynamic Prompt Adjustment, Multi-Stage Prompting, Intent Matching, Output Formatting, Custom Prompt Creation
    Dodaj do ulubionych
  • AI-Driven Technology AI Powered Assistants, IoT Device Management, Data Analytics Integration.
    Dodaj do ulubionych
  • Vector infographics six circles with arrows. Line business concept of 6 steps, options. Infographic template for diagram, web, banner, presentations, flowchart, content, levels, chart
    Dodaj do ulubionych
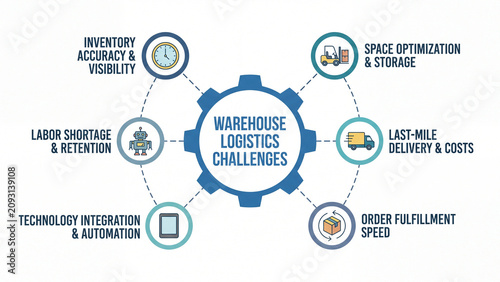
  • Warehouse logistics challenges infographic covering inventory accuracy labor shortage space optimization delivery costs automation and order fulfillment in supply chain management
    Dodaj do ulubionych
  • 70 20 10 model for learning development infographic 3 point stage template with circle circular and connecting content for slide presentation
    Dodaj do ulubionych
  • Vector infographic template for diagram, graph, presentation, chart, business concept with 8 options.
    Dodaj do ulubionych
  • Flat business presentation vector slide template with diagram chart
    Dodaj do ulubionych
  • Automate End-to-End Marketing.
    Dodaj do ulubionych
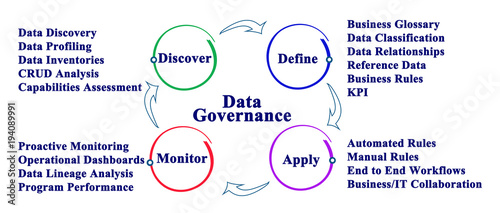
  • Data Governance Process
    Dodaj do ulubionych
  • RASCI framework infographic template banner with big cirlce shape circular cycle on center with 5 point list information for slide presentation
    Dodaj do ulubionych
  • Modern 6 steps outline business timeline infographic layout, corporate development roadmap line art diagram slide with thin pin shapes vector illustration
    Dodaj do ulubionych
  • Timeline infographic icons designed for abstract background template milestone element modern diagram process technology digital marketing data presentation chart Vector. eps 10
    Dodaj do ulubionych
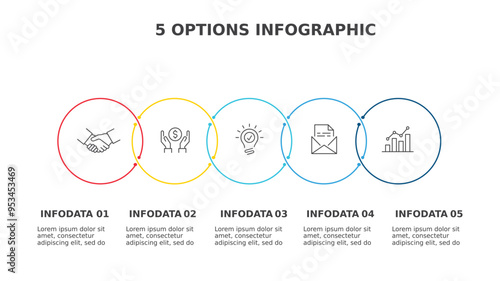
  • Abstract elements of graph infographic template with label, integrated circles. Business concept with 4 options. For content, diagram, flowchart, steps, parts, timeline infographics, workflow layout.
    Dodaj do ulubionych
  • Business infographic element with options, steps, number vector template design
    Dodaj do ulubionych
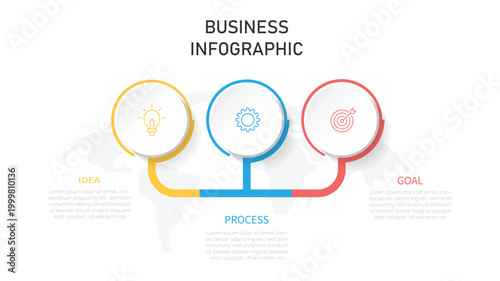
  • Modern vector illustration. Infographic circles template with three elements, sectors, icons. Designed for business, presentations, web design, interface, workflow layout, diagrams with 3 steps
    Dodaj do ulubionych
  • 6 Step and Six 6 Option cloud Business data visualization. Process chart. Abstract elements of graph, diagram with steps, options, parts or processes. business template for presentation.
    Dodaj do ulubionych
  • Vector line infographics template for three arrows and circles. Business concept with 3 elements and icons. Modern blank space for chart, content, step for step, timeline, diagram, web
    Dodaj do ulubionych
  • Business professional analyzing workflow diagram on digital tablet in office setting with copy space
    Dodaj do ulubionych
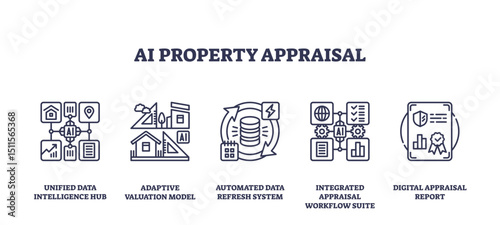
  • AI property appraisal features outlined with icons of data hub, valuation model, database, workflow, and report, symbolizing digital real estate analysis, transparent background. Outline icons set
    Dodaj do ulubionych
  • Web Site Design Process.
    Dodaj do ulubionych
  • 6 steps infographic template with 6 options. Flowchart that can be used for business report, data visualization and presentation. Timeline infographic elements vector illustration.
    Dodaj do ulubionych
  • Infographic vector element
    Dodaj do ulubionych
  • CRM customer relationship management infographic 3 point stage template with outline circle connecting network content for slide presentation
    Dodaj do ulubionych
  • Infographics timeline with 6 steps, icons. Line data vector template. Used for diagram, business, web, banner, workflow layout, presentations, info graph, content, levels, processes diagram
    Dodaj do ulubionych
  • Buyer's Journey map infographic diagram chart template with icon vector for business presentation has unaware, problem, solution, product and most aware. Personal goals setting, strategy plan concept.
    Dodaj do ulubionych
  • Hand drawn timeline infographics template with six arrows, vector eps10 illustration
    Dodaj do ulubionych
  • Modern timeline diagram and infographic template for business
    Dodaj do ulubionych
  • ogsm goal setting and action plan framework infographic 4 point stage template with circle comment callout for slide presentation
    Dodaj do ulubionych
  • Flat business presentation vector slide template with diagram chart
    Dodaj do ulubionych

Ta strona używa ciasteczek do przechowywania informacji na Twoim komputerze. więcej >> ×