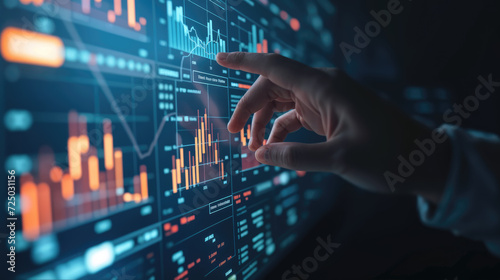
Hand pointing at financial chart displayed on digital screen showing stock market analysis.
Dodaj do ulubionych
Analysis of AI trading. Artificial intelligence for hand-tracking sales graphs. Automated digital marketing online

Dodaj do ulubionych
Businessman hand pointing finger to growth success finance business chart of metaverse technology financial graph investment diagram on analysis stock market background with digital economy exchange
Dodaj do ulubionych
Crypto Trading theme with hand pressing a button on a technology screen
Dodaj do ulubionych
Secure your network with digital barriers and high tech security audits, implementing visual data controls and locking mechanisms to protect against cyber threats.
Dodaj do ulubionych
An interaction with a glowing display of performance metrics and customer analytics, bright neon blue light reflecting off of the sleek dashboard.
Dodaj do ulubionych
Human analyzing business data using projection diagrams.
Dodaj do ulubionych
Closeup of hand holding a futuristic chip over data screens displaying graphs and charts, symbolizing technology and financial analysis.
Dodaj do ulubionych
Businessman hand pointing finger to growth success finance business chart of metaverse technology financial graph investment diagram on analysis stock market background with digital economy exchange
Dodaj do ulubionych
Close-up of a hand interacting with a digital financial chart on a touchscreen, representing stock market analysis and trading.
Dodaj do ulubionych
Interactive Data Analysis on Digital Screen by Professional Analyst
Dodaj do ulubionych
Analyzing financial data trends digital workspace infographic high-tech close-up insights for investors
Dodaj do ulubionych
Global Performance management, Close-up image of a person's hand interacting with a futuristic digital interface showing graphs, world map, and data analytics.
Dodaj do ulubionych
Hand Interacting with Stock Market Data
Dodaj do ulubionych
Businessman hand pointing finger to growth success finance business chart of metaverse technology financial graph investment diagram on analysis stock market background with digital economy exchange
Dodaj do ulubionych
A person interacts with an advanced digital screen displaying various financial statistics and data analysis graphs.
Dodaj do ulubionych
Hand interacting with a digital stock market display showing graphs and data.
Dodaj do ulubionych
analysis working with the latest financial results. Analysis of sales forecast graphs, financial accounting with hand writing Abstract digital effect for background
Dodaj do ulubionych
Dynamic Financial Data Visualization with Interactive Touchscreen
Dodaj do ulubionych
A hand interacting with a futuristic interface with glowing data and security lock icon displayed
Dodaj do ulubionych
Hand Interacting with Digital Interface, Futuristic Technology, Data Analysis, Data Visualization
Dodaj do ulubionych
Close-up hand that touches on digital, IoT, AI chatbot technology, smart devices, VPN cybersecurity.
Dodaj do ulubionych
A robot with human-like features reviews financial statistics on high-tech display panels, implicating AI's role in analytics
Dodaj do ulubionych
A professional hand in a sharp black suit pressing a bold red "Sell" button on a futuristic trading interface, dynamic graphs and numbers glowing around the screen,
Dodaj do ulubionych
A professional using analytics software to optimize business performance, real-time data visualization on digital displays
Dodaj do ulubionych
Finance Analyst Analyzing Stock Market Data on Virtual Screen for Business Growth Strategy
Dodaj do ulubionych
Hand Pointing at Stock Market Data
Dodaj do ulubionych
Hand pressing glowing red digital screen interface. Futuristic technology concept.
Dodaj do ulubionych
Businessman discussing investment risks with detailed data and charts market trends
Dodaj do ulubionych
CRM platform.
Dodaj do ulubionych
Futuristic display with a hand touching digital interface text.
Dodaj do ulubionych
Person Pointing at Data Display
Dodaj do ulubionych
Close-up view of digital screens displaying dynamic financial data analysis graphs and metrics
Dodaj do ulubionych
Businessman finger touching digital bank glowing hologram and empty background
Dodaj do ulubionych
Action plan concept: A person interacting with an icon on a virtual screen that represents an action plan, focusing on business and marketing objectives, strategy, and implementation. This visual high
Dodaj do ulubionych
Business Finance Data Analytics Graph: Financial Management Technology with Advisor Using KPI Dashboard on Virtual Screen. Data management system (DMS), Business analytics.
Dodaj do ulubionych
Hand connecting network cable in server rack.
Dodaj do ulubionych
Fintech engineers working on cutting-edge technologies to streamline payment systems and transactions
Dodaj do ulubionych
A team of lifestyle journalists utilize automated datadriven journalism to analyze consumer spending data and produce articles on the latest consumer trends and preferences.
Dodaj do ulubionych
Businessman hand pointing to stock market graph
Dodaj do ulubionych
Ta strona używa ciasteczek do przechowywania informacji na Twoim komputerze. więcej >>×