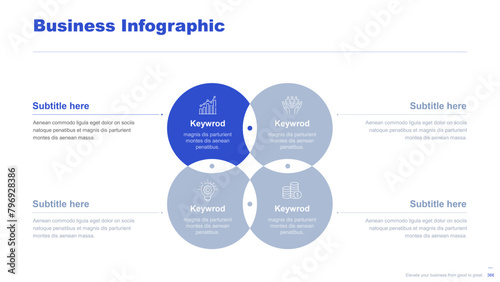
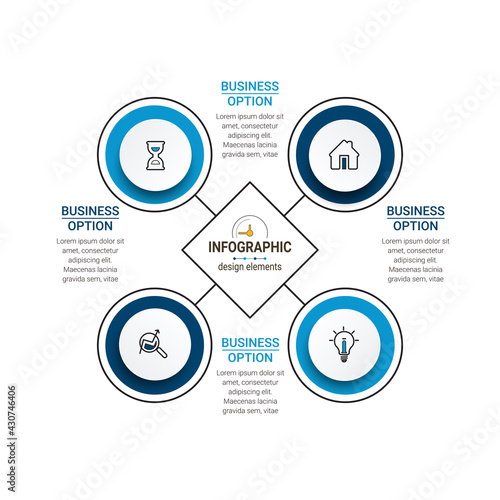
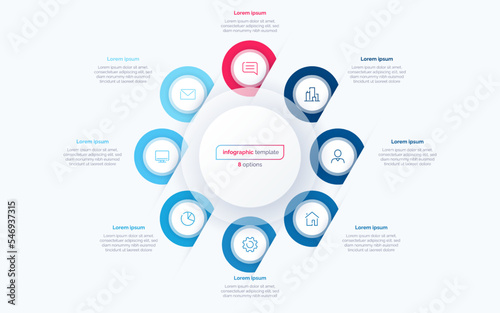
Flat business infographic diagram vector slide presentation template
Dodaj do ulubionych
Understanding the Female Hormonal Cycle A Visual Guide to Menstrual, Follicular, and Ovulation Phases
Dodaj do ulubionych
human employee vs ai artificial intelligence versus comparison opposite infographic concept for slide presentation with big outline circle on center with description on left and right with flat style
Dodaj do ulubionych
Business infographic vector illustration 5 steps or options with icons
Dodaj do ulubionych
Circular infographic template
Dodaj do ulubionych
Venn Diagram
Dodaj do ulubionych
Modern Infographic Template
Dodaj do ulubionych
Business data visualization. timeline infographic icons designed for abstract background template. vector banner can be used for workflow layout, diagram,presentation, education or any number option.
Dodaj do ulubionych
Eight option circle infographic design template. Vector illustration
Dodaj do ulubionych
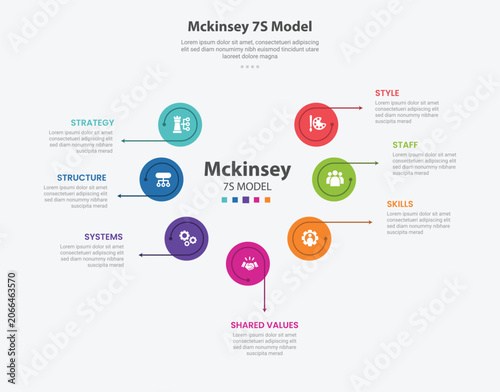
McKinsey 7S Framework Diagram for Business Strategy
Dodaj do ulubionych
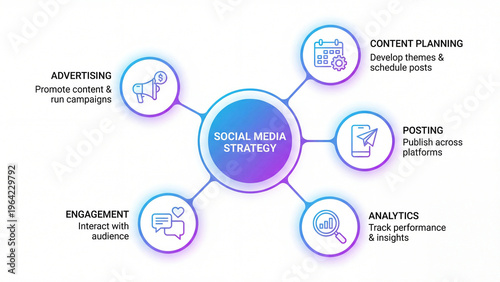
Social media strategy planning and digital marketing management infographic illustrating content planning advertising posting engagement and analytics tracking for business growth brand awareness
Dodaj do ulubionych
Infographic template for business. 12 Months modern Timeline diagram calendar with circles, presentation vector infographic.
Dodaj do ulubionych
4 Steps Infographic four diamond-shaped or rhombus elements are positioned around the central circle, each representing a single step in the process. Simple infographic design template.
Dodaj do ulubionych
Timeline infographic presentation template with 4 steps or options. Four phase process infographics elements. Journey with 4 arrow steps, four number options. Vector.
Dodaj do ulubionych
Vector infographic label design with circle infographics template design and 4-5-6 options or steps. Can be used for process diagram, presentations, workflow layout, banner, flow chart, info graph.
Dodaj do ulubionych
Venn Diagram
Dodaj do ulubionych
Simple process diagram template with four colorful stages. Easy to use for your website or presentation.
Dodaj do ulubionych
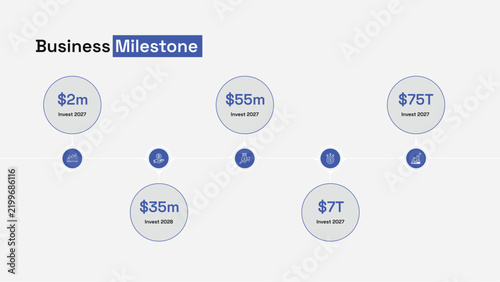
Business milestone financial investment infographic with five data points
Dodaj do ulubionych
10 Steps - Circle Infographics
Dodaj do ulubionych
Vector infographic template
Dodaj do ulubionych
ogsm goal setting and action plan framework infographic 4 point stage template with circle comment callout for slide presentation
Dodaj do ulubionych
Infographic numbers steps element. Circle graphic chart diagram, business graphic design. Vector illustration
Dodaj do ulubionych
Pie charts for infographics. Elements with 4 steps, options. four step infographic for design and ppt
Dodaj do ulubionych
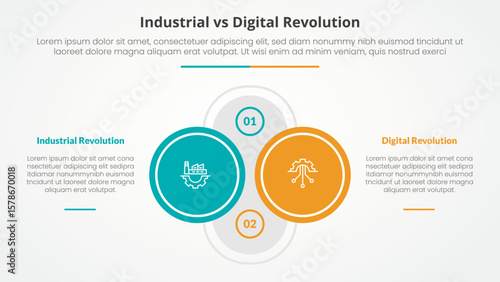
industrial vs digital revolution comparison opposite infographic concept for slide presentation with big outline circle on center with description on left and right with flat style
Dodaj do ulubionych
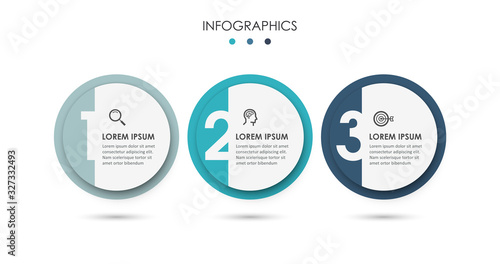
Infographic template with main title and 3 elements, flowchart
Dodaj do ulubionych
Mckinsey 7S model infographic outline style with 7 point template with circle circular direction with arrow line for slide presentation
Dodaj do ulubionych
360 degrees, Search statistics and Parking line icons set. Timeline infographic. Love cooking sign. Full rotation, Analysis, Park pointer. Chef hat. Business set. 360 degrees icon. Vector
Dodaj do ulubionych
INFOGRAPHICS DESIGN 33
Dodaj do ulubionych
modern infographics options banner with 5 option vector illustration.
Dodaj do ulubionych
Infographic template with 2 steps or options with place for your icons and text, workflow, process chart
Dodaj do ulubionych
3 pillars of scrum infographic template with three point outline circle crescent scale balance layout, outline style
Dodaj do ulubionych
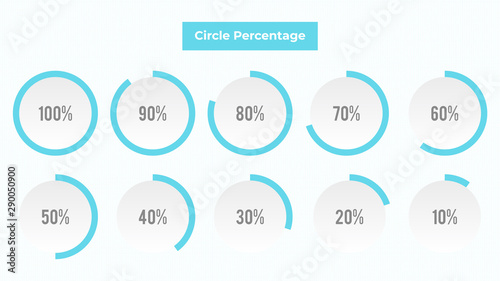
Pie charts, circle percentage diagrams of loading Vector
Dodaj do ulubionych
Minimal cryptocurrency infographic with global user data, market share and blockchain activity, presented in a clean modern layout with simple data visualization.
Dodaj do ulubionych
Business data visualization. Process chart. Abstract elements of graph, diagram with 3 steps, options, parts or processes. Creative concept for infographic.
Dodaj do ulubionych
Business infographic template. 2 Step timeline journey. Process diagram, 2 options, Infographic elements vector illustration.
Dodaj do ulubionych
Four topics 3D colorful marble circle on sequence for website presentation cover poster vector design infographic illustration concept
Dodaj do ulubionych
Vector illustration. Glassmorphism infographic with three circles and icons. Minimal liquid glass effect. Template for presentation slide.
Dodaj do ulubionych
Venn Diagram
Dodaj do ulubionych
INFOGRAPHICS DESIGN 24
Dodaj do ulubionych
Business data visualization. Infographic element with icons and options or steps. Can be used for process, presentation, diagram, workflow layout, info graph, web design. Vector business template.
Dodaj do ulubionych
Ta strona używa ciasteczek do przechowywania informacji na Twoim komputerze. więcej >>×